What if we could create a digital farmer’s almanac, one that uses data to give precise recommendations for nourishing our crops? In a world striving for sustainable agriculture, helping farmers choose the exact right fertilizer is more important than ever. This was the goal of my latest machine learning adventure: to build a model that acts like an agricultural expert, recommending the best fertilizer based on soil, weather, and crop type.
This project was a deep dive into the world of multi-class classification and taught me some powerful new modeling techniques. I uncovered fascinating relationships between soil nutrients and crop needs and built a “meta-model” that achieved almost perfect accuracy! Here’s the story of how I cultivated this data-driven solution. As always, the full code is in my Kaggle notebook.
1. The Soil and the Seed: Understanding the Data 🌾
The dataset for this project was a farmer’s dream. It contained a rich mix of environmental and agricultural data points, all leading to a final Fertilizer Name recommendation. The features I had to work with were:
- Environmental Conditions: Temperature, Humidity, and Moisture levels.
- Soil Information: Soil Type (e.g., Loamy, Sandy, Clayey) and the core chemical makeup – the NPK values representing Nitrogen, Potassium, and Phosphorous levels.
- Crop Information: The specific
Crop Typebeing grown (e.g., Paddy, Sugarcane, Cotton).
My mission was to predict which of the seven different fertilizer types was the optimal choice.
2. Surveying the Land: What the Data Revealed 🗺️
Before building any models, I spent a lot of time exploring the data (a process called EDA) to find hidden patterns. This was where the project really came to life!
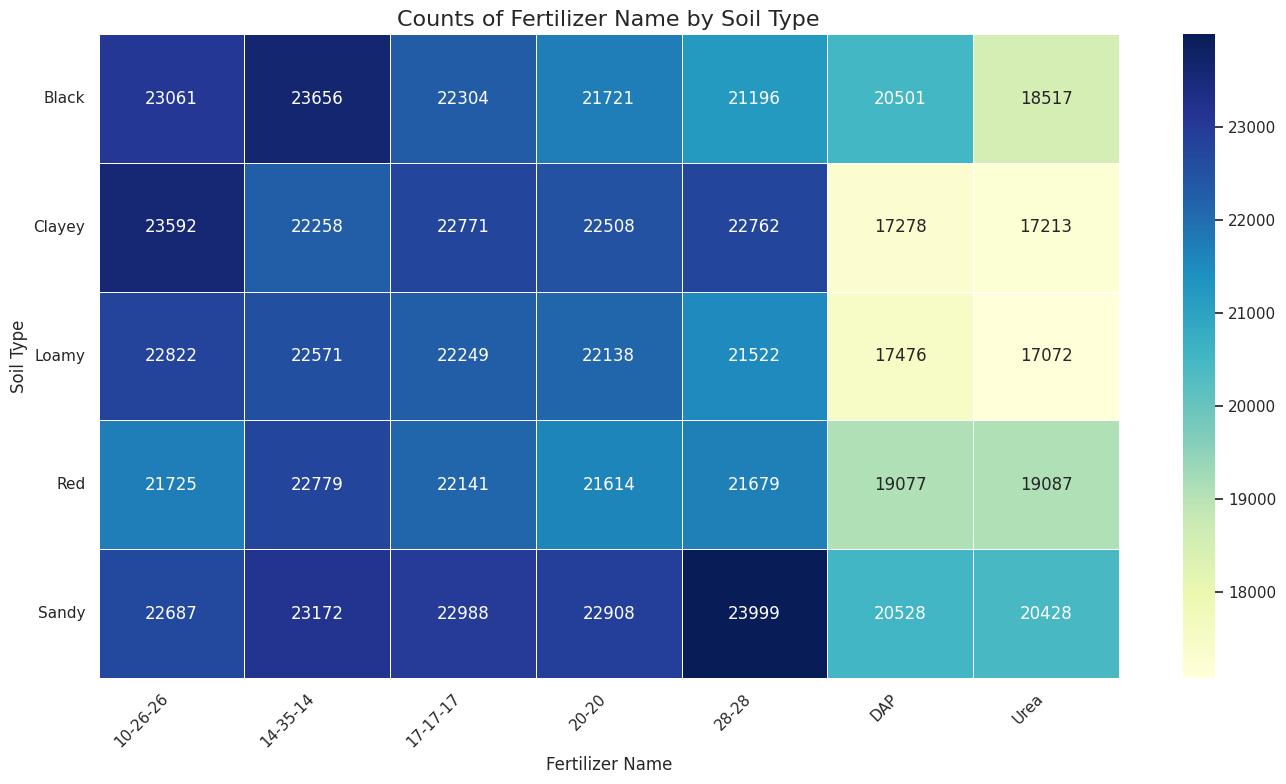
- An Imbalanced Field: The first thing I noticed was that the recommendations were not evenly distributed. ‘Urea’ was the most frequently recommended fertilizer, while ‘28-28-0’ was the least. This is known as an imbalanced dataset, a common challenge in real-world data science.
- Nutrient Signatures: By visualizing the N-P-K levels for each fertilizer, clear “signatures” emerged. For example, ‘Urea’ was almost always recommended when Nitrogen levels were high, while ‘DAP’ was the choice for high Phosphorous levels. This made perfect intuitive sense!
- Crop-Fertilizer Pairing: The most powerful insight came from looking at
Crop TypeversusFertilizer Name. The relationships were incredibly strong. For instance, ‘Urea’ was almost exclusively for Sugarcane, while ‘DAP’ and ‘Potash’ were overwhelmingly used for Paddy. This told me that the type of crop being grown was a huge predictor of the fertilizer needed.
These discoveries were fantastic because they confirmed the data was logical and contained strong signals that a machine learning model could learn from.
3. Preparing for Planting: Data Preprocessing 🚜
Like my previous projects, the raw data needed a bit of prep work. The models I planned to use work with numbers, not text. So, I converted the categorical features like Soil Type, Crop Type, and the target variable, Fertilizer Name, into numerical representations. With that simple step, the data was ready for the main event.
4. The Harvest of Models: Introducing the Meta Model! 🤖
For this challenge, I brought out some heavy-hitting classification models: XGBoost and CatBoost. Both are renowned for their accuracy and are staples in the competitive Kaggle scene.
But I wanted to try something even more powerful: a Meta Model, also known as a Stacking Classifier.
Think of it like this: instead of relying on a single expert, you consult a panel. In my stacking model: 1. The Experts: XGBoost and CatBoost each made their own independent predictions on the data. 2. The Manager: A final “meta-learner” model (I used Logistic Regression for this) then looked at the predictions from both experts. Instead of looking at the original data, its job was to learn from the experts’ outputs to make an even more accurate and robust final decision.
This technique of combining models is a form of ensemble learning, and the results were phenomenal! I evaluated the models on their accuracy, and the performance was off the charts.
| Model | Accuracy |
|---|---|
| Meta Model (Stacking) | 99.6% |
| CatBoost | 99.2% |
| XGBoost | 99.2% |
Achieving 99.6% accuracy with the Meta Model was a huge success! It means the “manager” model was incredibly effective at leveraging the strengths of the two “expert” models, resulting in very few misclassifications.
5. Conclusion: The Future of Farming is Data-Driven 💡
This project was a fantastic lesson in both agricultural science and advanced modeling techniques. It was amazing to see how clearly the data reflected real-world farming logic and even more exciting to build a “team” of models that could learn these patterns to near perfection.
It’s a powerful demonstration of how machine learning can be used to create practical, data-driven tools to support critical industries like agriculture. By helping farmers make more informed decisions, we can work towards healthier crops and a more sustainable future.
Thanks for following along on this project. Now, what to grow next? 🤔