INTRO - Kaggle competiton
I’m incredibly excited to share a personal milestone! I recently competed in the Kaggle “Predict Calorie Expenditure” competition and earned a silver medal, placing 358th out of 4,316 teams! 🥈
What makes this moment so special is that just six months ago, I completed my Google Advanced Data Analytics Professional Certificate and started my journey with Python. To go from the fundamentals to ranking in the top 8% among 9,300+ entrants globally is a feeling I can barely describe. It’s a powerful reminder that with focus and hands-on practice, rapid growth is possible.
For those new to the field: –> Kaggle is the world’s largest online community for data scientists and a platform for machine learning competitions. It’s like a global stadium for data challenges.
–>The solution involved MachineLearning (ML), the same core technology that trains the powerful Artificial Intelligence (AI) systems making headlines today. We used data to teach a model to make predictions. This experience was a phenomenal learning curve. A huge thank you to the data science community for the inspiration!
I’ve shared my complete approach in my silver-medal-winning Kaggle notebook. It covers everything from Exploratory Data Analysis (EDA) to the final model blending. I would be thrilled if you took a look!
The journey was a fantastic “workout” for my data science skills! I discovered which factors are most important for torching calories and trained some powerful models to make surprisingly accurate predictions. Here’s the story of how I did it. (If you want to see the code behind the sweat, you can check out my full Kaggle notebook here).
1. The Data Workout: Getting to Know the Metrics 📊
The project started with two datasets: one containing personal information like age, weight, and height (exercise.csv), and another with the corresponding calories burned for each workout session (calories.csv). The first step was simple: merge them together into one master dataset.
This gave me a clear set of features to work with for each person’s workout: * Personal Info: Gender, Age, Height, Weight * Workout Metrics: Duration, Heart Rate, Body Temperature * The Goal: Calories (this is the value I wanted to predict)
With the data combined, it was time to warm up with some exploration to understand the relationships hiding within.
2. Warming Up: What the Data Told Me 📈
Before training any models, I performed some Exploratory Data Analysis (EDA) to see what patterns I could find. Visualizing the data is like stretching before a run—it prepares you for the main event!
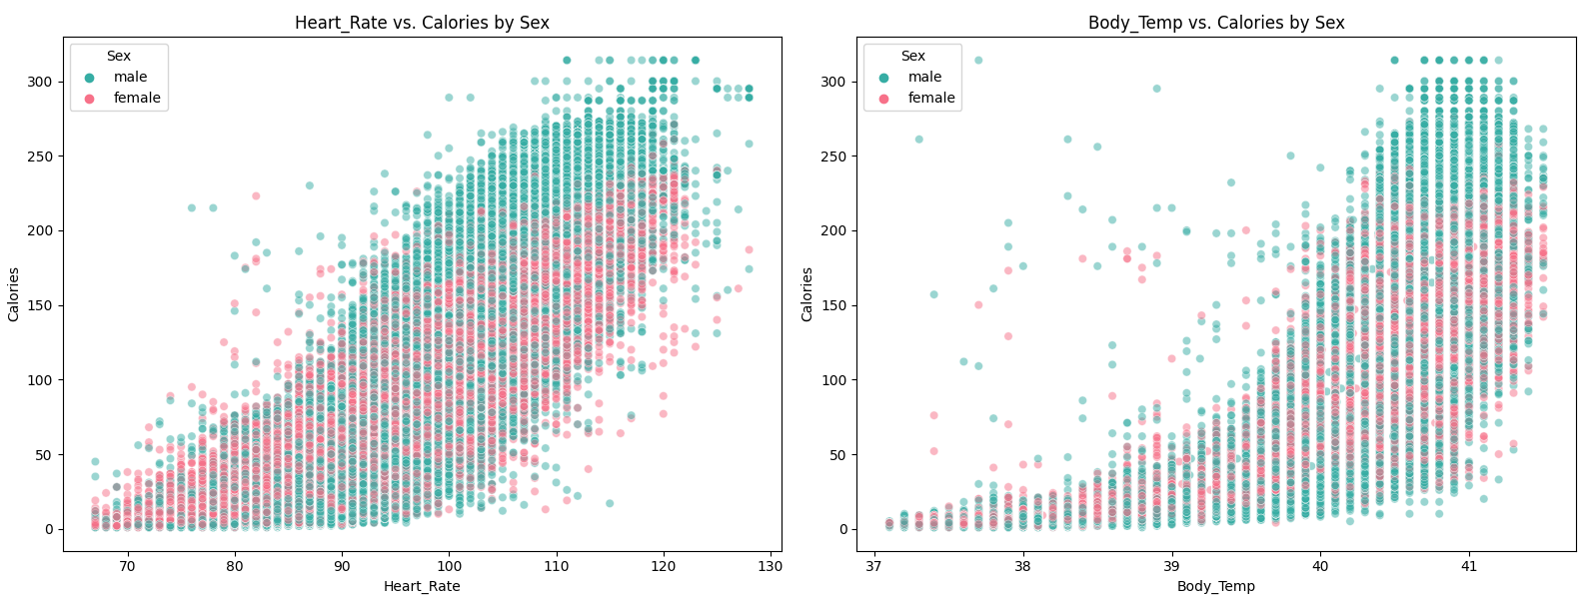
I created a correlation heatmap, which is a colorful grid that shows how strongly each feature is related to the others. The results were crystal clear and incredibly insightful:
- Top Predictors: The features most strongly correlated with
Caloriesburned were Duration, Heart Rate, Body Temperature, and Age. This makes perfect sense! The longer you work out, the higher your heart rate and body temp get, and the more calories you burn. - Less Impactful: Interestingly,
HeightandWeighthad a much weaker correlation. While they play a role, they weren’t the main drivers of calorie expenditure in this dataset.
This step was vital. It confirmed that the workout metrics were the most important signals my machine learning model should pay attention to.
3. The Pre-Workout Routine: Data Prep ⚙️
My dataset was surprisingly clean, with no missing values! 🙌 My only preparation task was a simple but crucial one: converting the Gender column from categorical text (‘male’/‘female’) into numerical values (0 and 1). Machine learning models work with numbers, not text, so this “label encoding” is a standard step to get the data ready for training.
4. The Main Event: A Battle of the Boosting Models 🤖
With the data prepped, I was ready to train some powerful regression models. Since my goal was to predict a continuous number (calories), I used models designed for this type of task. I chose a family of advanced models called “boosting” algorithms, which are known for their high accuracy.
The contenders were: 1. XGBoost: A famous and incredibly fast model that often wins Kaggle competitions. 2. CatBoost: Another boosting model that’s particularly good at handling categorical data automatically. 3. LightGBM (LGBM): A lightweight and efficient model developed by Microsoft, also known for its speed and performance.
To measure how well each model performed, I looked at their R-squared (R²) score. An R² score tells you what percentage of the variation in the target variable (in this case, Calories) the model can explain. A score of 1.0 would mean a perfect prediction.
The results were astounding! All three models performed exceptionally well:
| Model | R² Score |
|---|---|
| XGBoost | 0.997 |
| LightGBM | 0.997 |
| CatBoost | 0.996 |
An R-squared score of 99.7% is fantastic! It means the models were able to predict the calories burned with extremely high accuracy based on the features I gave them. Both XGBoost and LightGBM were the top performers.
5. Cool-Down: Final Thoughts ✅
This project was a blast and really highlighted the power of machine learning in the fitness world. It was incredible to see how a few key metrics—like how long you exercise and how fast your heart is beating—can be used to predict calorie burn with such precision.
It demystified the technology behind our fitness trackers and was a great exercise (pun intended!) in applying powerful regression models. If you’re curious about the data behind your own workouts, I highly recommend exploring a project like this!
Thanks for reading, and keep moving! 🏃♀️💨